

LIVE COMMAND CENTER
Your AI stack,
in real time.
Monitor requests, usage, costs, latency and errors across all your models and providers — in a single, unified command center.
- Real-time
visibility - Proactive
alerts - Multi-model
control - Built for
teams
01LIVE OVERVIEW
Know what’s
happening at a glance
Get instant insights into request volume, token usage, cost, latency and error rate across your entire AI stack.
- Real-time metrics across all models
- Filter by team, environment and time range
- Spot anomalies instantly
02REAL-TIME TRAFFIC
Follow every signal
as it moves
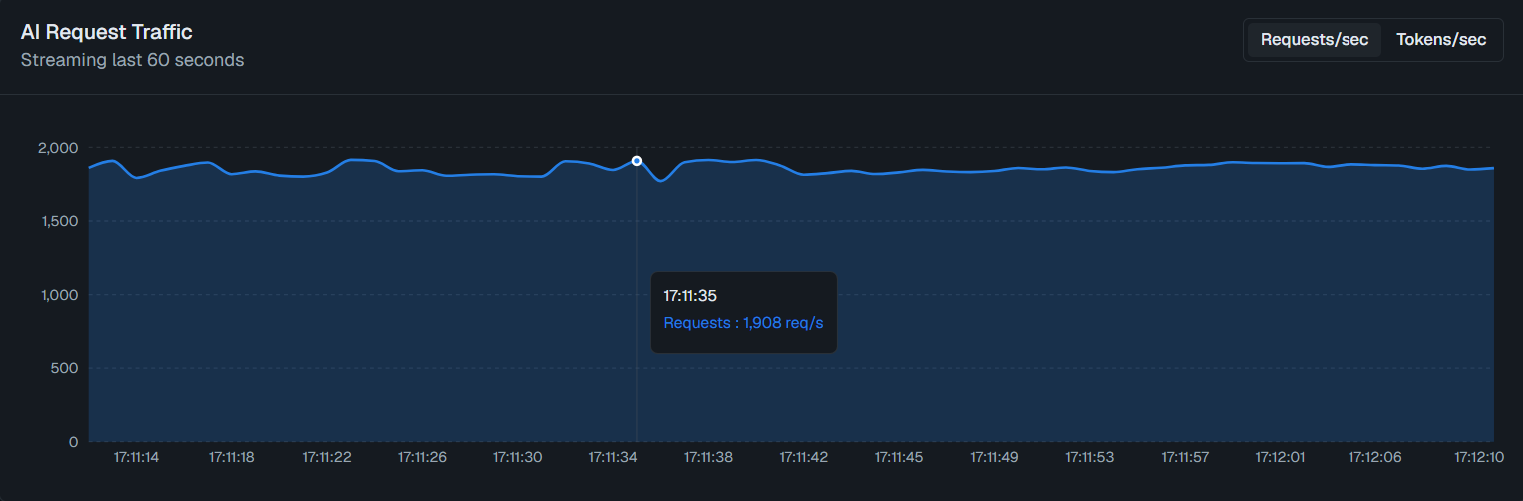
Track live request and token throughput, spot trends and anomalies, and inspect exact values with interactive charts.
- Live, low-latency charts
- Hover to inspect exact values
- Switch between requests and tokens
03MODEL USAGE & COST
Understand where
AI spend goes
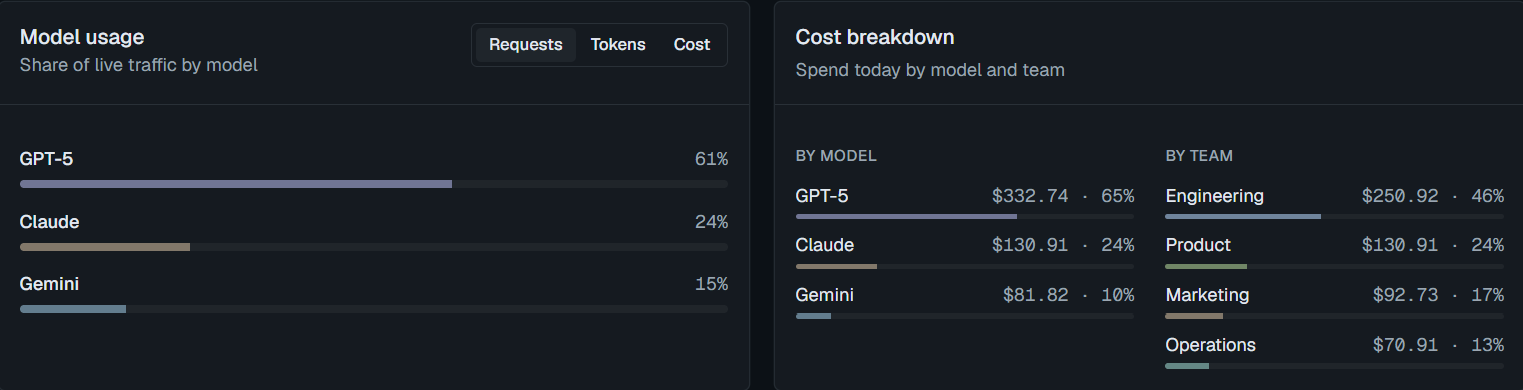
See model usage distribution, team allocation and detailed cost breakdowns. Make informed decisions and optimize your AI spend.
- Usage by model, team and application
- Real-time cost tracking
- Identify top drivers and optimize
04GATEWAY HEALTH
See the health of
every route
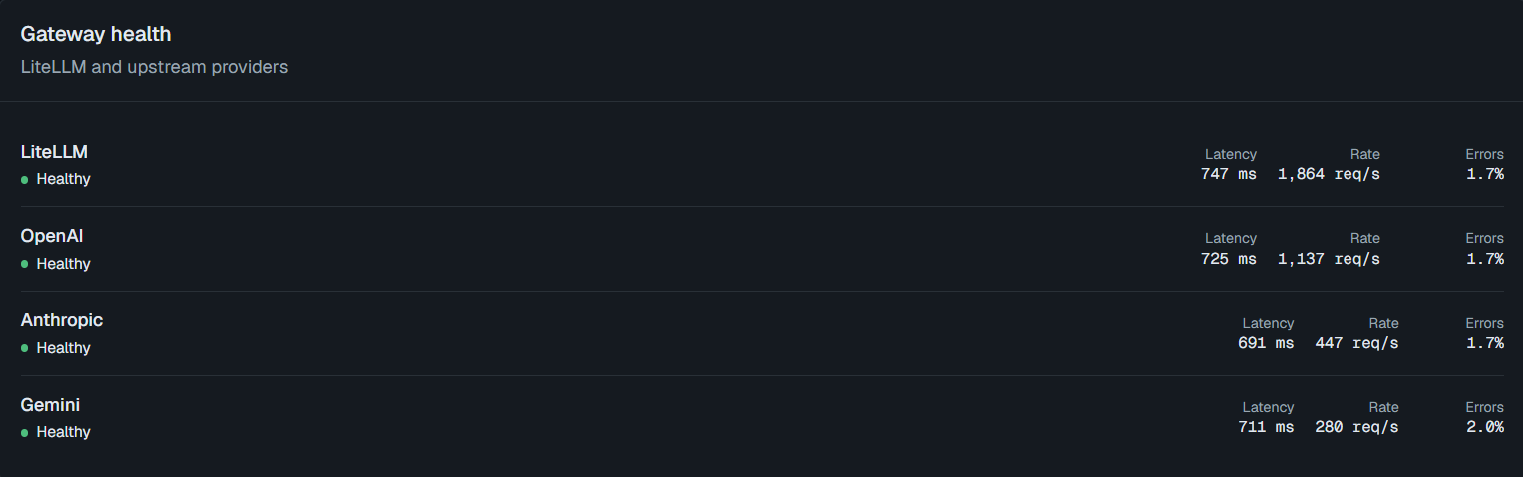
Monitor your gateway and upstream providers including LiteLLM. Track health status, latency, throughput and error rates in real time.
- Provider health at a glance
- Latency, throughput and error rates
- Stay informed with real-time updates
05ALERTS & ACTIVITY
Catch issues
before they spread
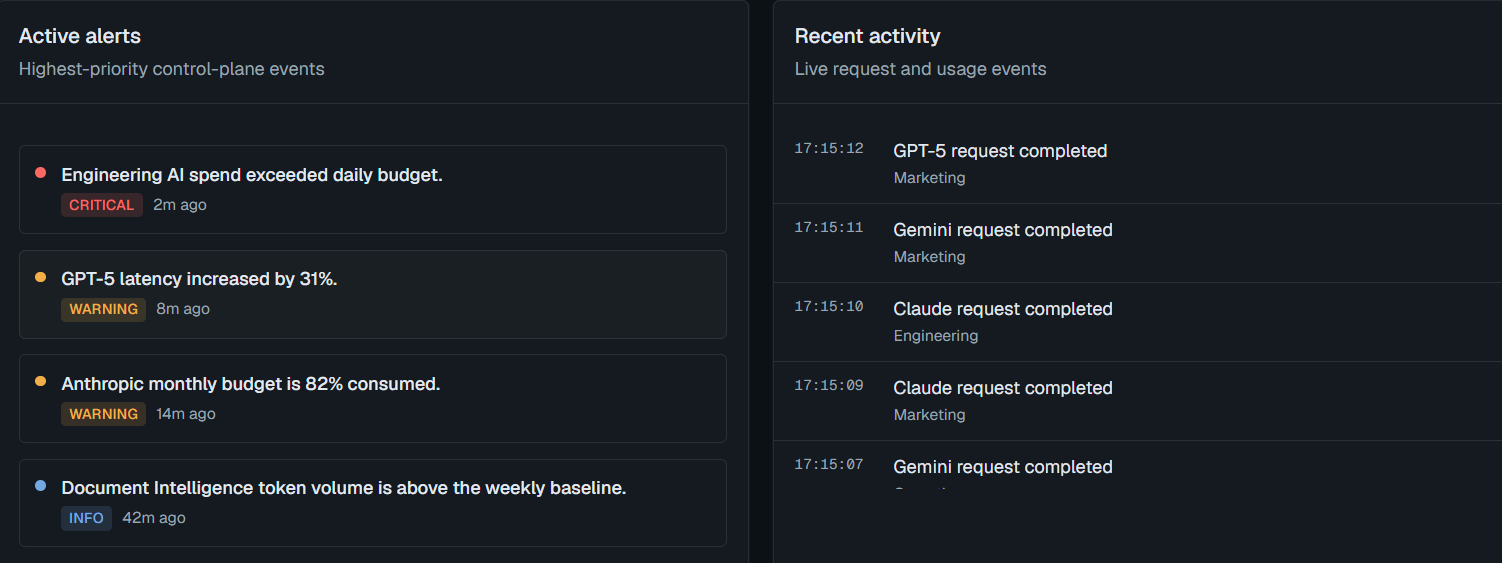
Get notified about high-priority events, budget thresholds, latency spikes and unusual usage patterns.
- Real-time alerts with severity levels
- Recent activity stream
- Drill down to investigate
TAKE CONTROL OF YOUR AI OPERATIONS
One live view. Better AI operations.
From requests to spend to reliability — everything you need to run your AI stack with confidence.
Get started for free